Everything about every device.
Macintosh and Windows.
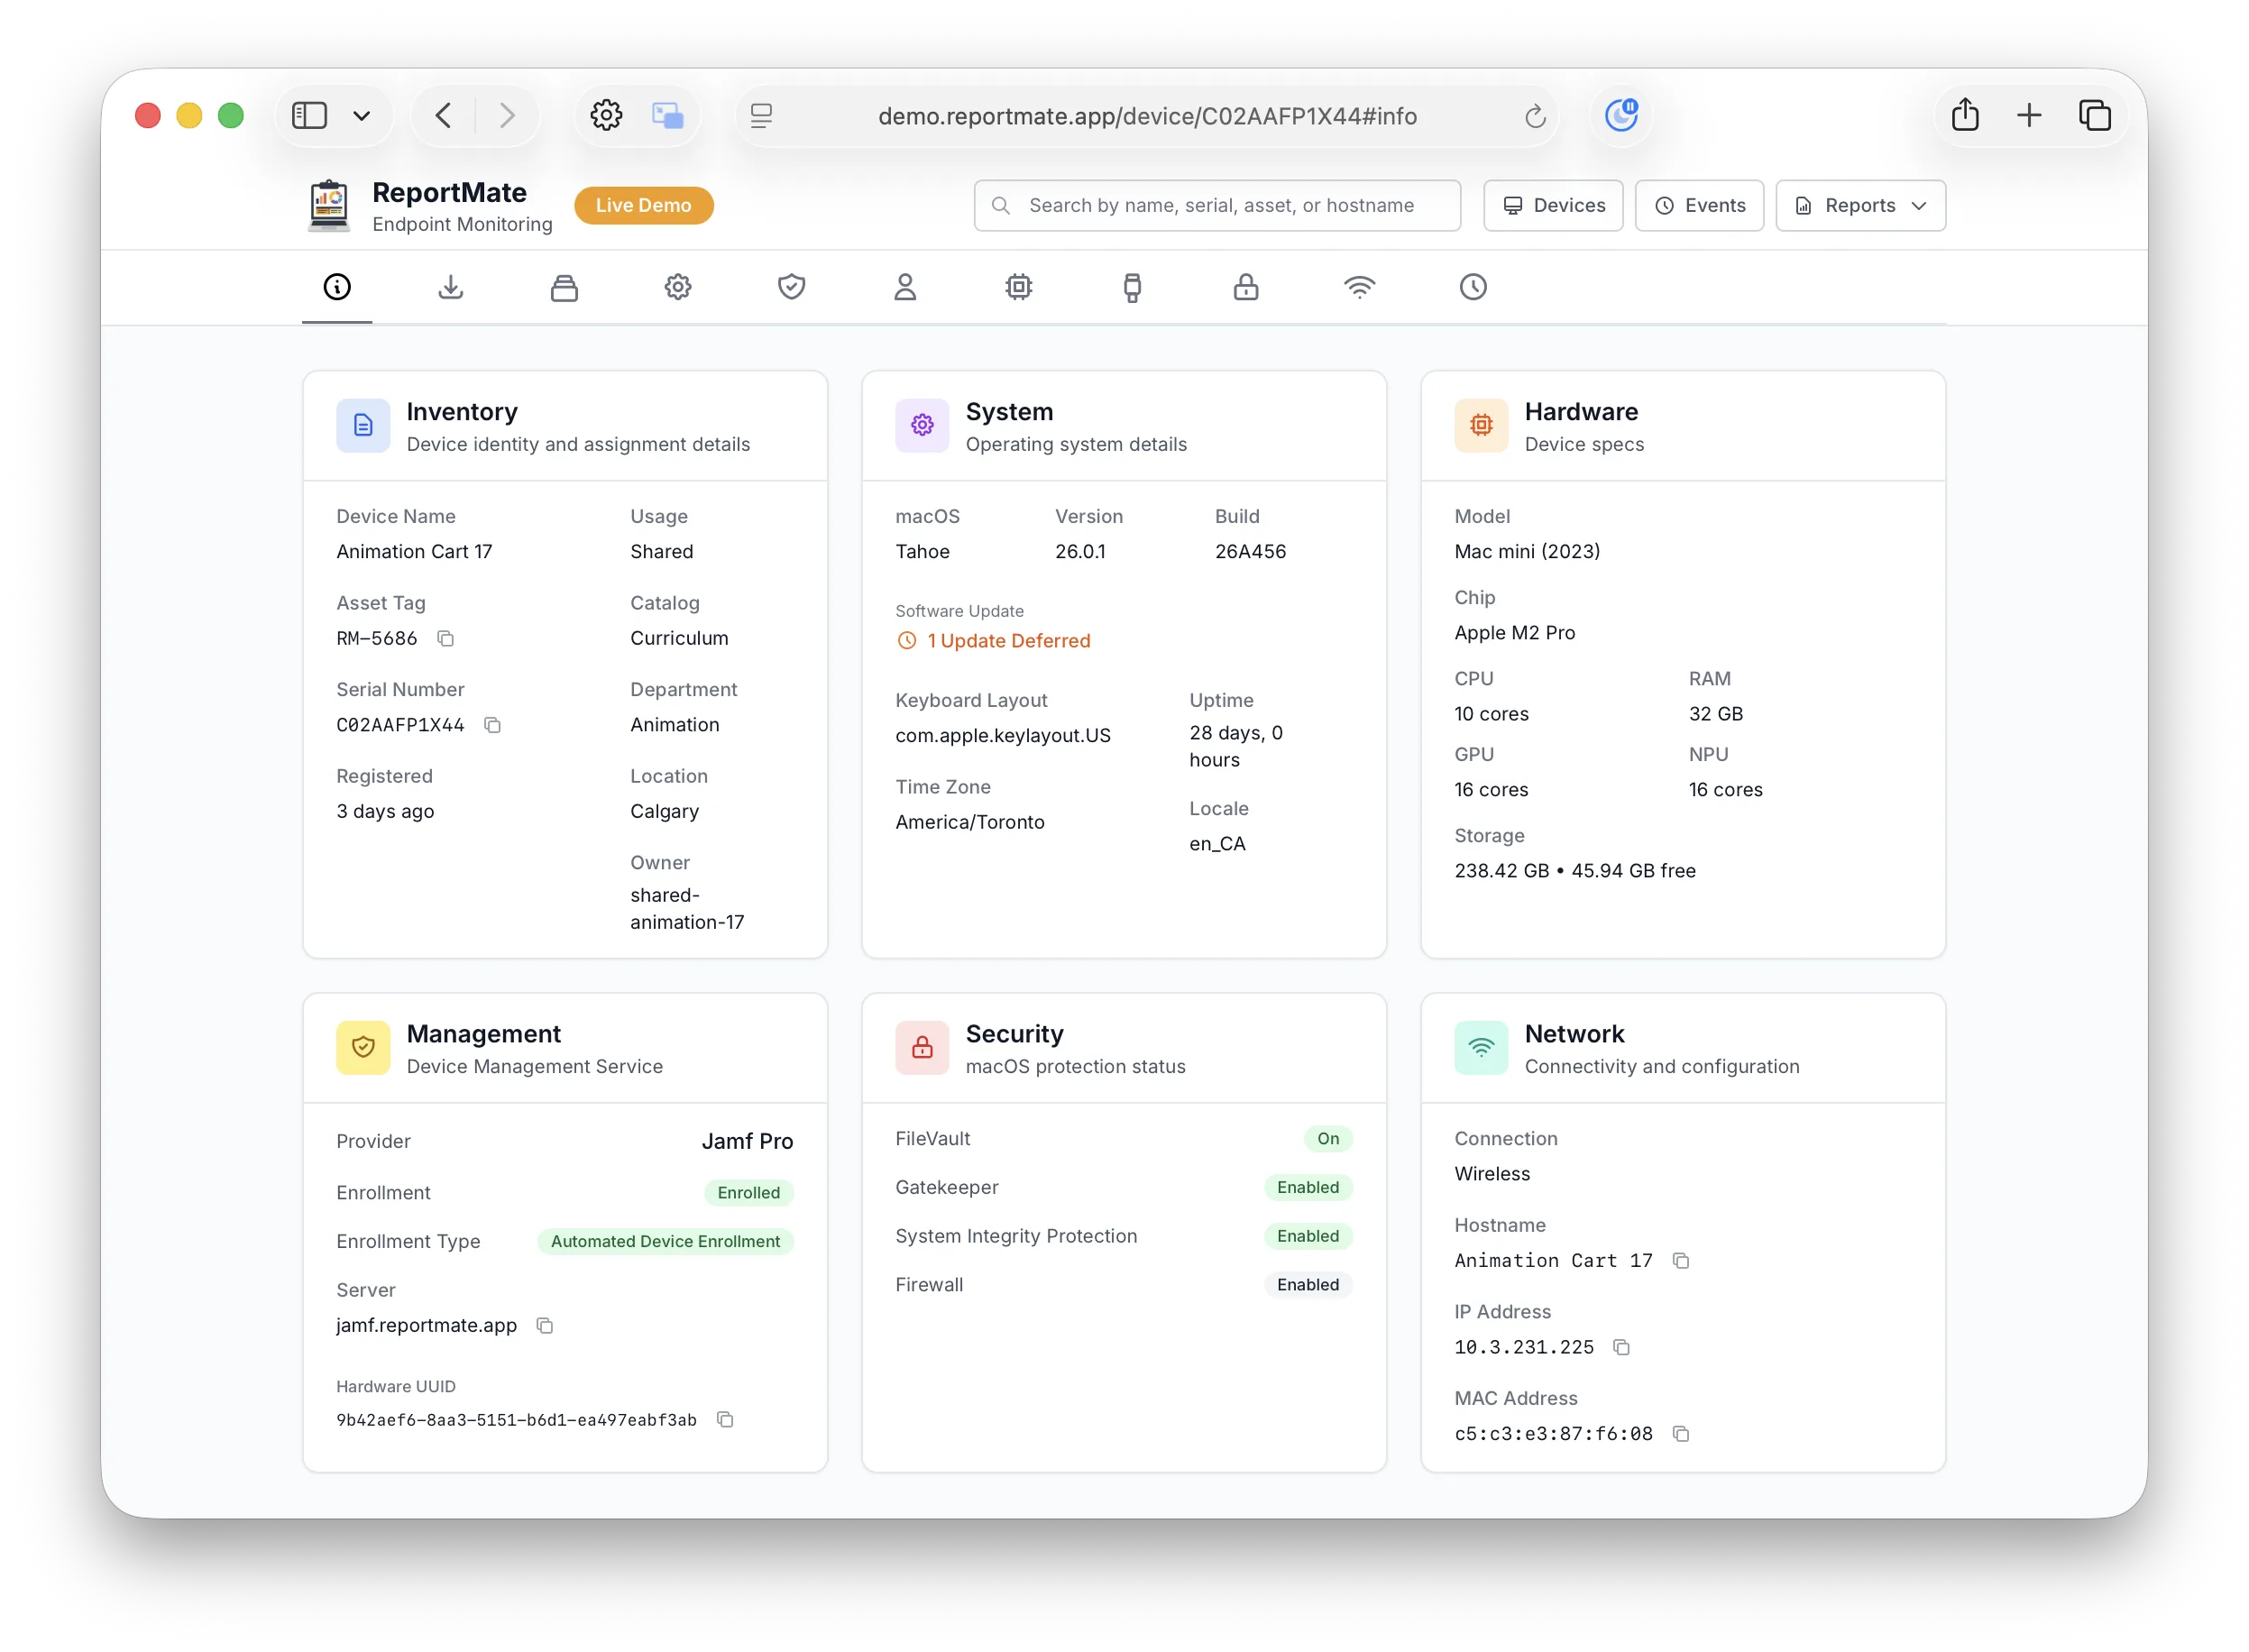
From the CPU and disk encryption to installed apps, Wi-Fi, the logged-in user, and managed software — ReportMate captures a complete picture of every device, the same way on Mac and Windows. Here is exactly what it collects.
Inventory
Asset tag, assigned owner, department, location, device name, manufacturer, model, and purchase metadata for asset reconciliation.
Installs
Managed software state from Cimian (Windows) and Munki (Macintosh): item name, target vs installed version, pending, installed, failed, plus install-session history and logs.
Applications
Installed applications with version, bundle identifier or product code, publisher, install date and size — normalized across Macintosh and Windows.
System
OS name, version & build, patch level, rapid security responses, uptime, boot time, kernel version, architecture, locale, time zone.
Management
MDM enrollment & vendor, supervision, configuration profiles, installed certificates, and managed-status — including profiles collected inline.
Identity
Console / logged-in user, full name, local and directory accounts, home directory, Entra ID / Active Directory join, and shared-device detection.
Hardware
Model & model identifier, manufacturer, serial number, CPU/SoC, performance & efficiency core counts, Neural Engine (NPU), GPU, total RAM with per-module manufacturer and type, storage devices, battery health & cycle count, thermals.
Peripherals
Displays (resolution, scaling, connection), printers (driver, default, network), and connected USB and Bluetooth devices — displays and printers collected within peripherals.
Security
FileVault / BitLocker encryption state, firewall, System Integrity Protection, Gatekeeper, secure/measured boot, TPM, XProtect, and presence of endpoint protection.
Network
Active connection, all interfaces, IPv4/IPv6, MAC addresses, DNS servers, gateways, Wi-Fi SSID with band/channel/width/protocol, signal strength, VPN status.
The fleet view updates as devices report in
Every client check-in is an event. The API ingests it, writes the module documents to PostgreSQL, and pushes an update to connected dashboards over SignalR/WebSocket — so what you see reflects reality without polling.
- Scheduled collection: launchd on Macintosh, service + scheduled task on Windows
- Event payloads over HTTPS, authenticated per client
- Raw payloads retained and retrievable per event for audit and debugging
A documented REST API for everything
FastAPI with a full OpenAPI specification — 50+ versioned endpoints under /api/v1.
Authenticated with per-client API keys (X-API-Key)
carrying read, ingest, and admin scopes, an OIDC bearer token, a client passphrase, or an internal secret for service-to-service. The published spec is regenerated from the API source, so it always matches what is deployed.
Devices
Per-device detail, fast info, events, install logs, usage history, and any single module document.
/api/v1/device/{serial}/modules/{module} Fleet
Bulk analytics across the whole fleet: hardware, applications, installs, identity, inventory, plus distributions and filters.
/api/v1/hardware Events
Ingest device check-ins and retrieve the event stream and raw payloads.
/api/v1/events Statistics
Pre-aggregated dashboard data and install statistics for at-a-glance fleet health.
/api/v1/dashboard Settings
Tenant settings and dynamic inventory key discovery.
/api/v1/settings Health
Liveness checks and the SignalR negotiate endpoint that powers real-time updates.
/api/v1/negotiate Architecture
Client agents
- Macintosh: native Swift binary, launchd-scheduled, osquery + system APIs
- Windows: C#/.NET binary, Windows service + scheduled task, osquery integration
- Collection is a single self-contained binary — quick to deploy, nothing to maintain
Server stack
- API: FastAPI with versioned REST endpoints and a published OpenAPI spec
- Frontend: Next.js, server-rendered, reader-only with real-time updates; the same views as native Macintosh and Windows apps
- Database: PostgreSQL with JSONB, one document per module
- Infrastructure: Terraform modules for Azure and AWS
See how the layers connect on the architecture diagram.
Beyond the browser
The same fleet, as native apps and from any shell. Everything reads the one documented API, so what the dashboard shows, the apps show and the command line prints.
ReportMate for Mac
A native SwiftUI app with every fleet view and device tab, reportmate:// deep links, and a This Mac mode that reads the local agent's cache with no API at all.
ReportMate for Windows
The dashboard as a native WPF app: fleet views, device detail, and the report for the machine it runs on, built from the local cache.
reportmate-app-csharp →reportmateutil
One binary with a command for every API route. --output json prints exactly what the API returned, so scripts and coding agents read the fleet without an HTTP client. Both apps ship it: on the Mac at /usr/local/bin/reportmateutil, on Windows beside the app on the PATH.
On the roadmap
Self-service cloud portal
Sign up, provision a managed tenant, and manage billing without leaving the browser.
MCP server
A Model Context Protocol server so AI assistants can query your fleet and answer questions in natural language.
More integrations
Webhooks and turnkey connectors for CMDB, SIEM, and asset systems on top of the existing API.